This week’s blog is coming in from California and is compliments of Karen and her eight-year-old son, Aaron. They are in RS2 Level C, Lesson 113, and had a question on the worksheet.
Lesson 113, Addition Sum Line Plots, has us first determine the number of facts for sums from 2 to 18, then construct a line plot with the results. Of course, as we’re figuring out the facts, we’re practicing our addition!
Consider:
11 =
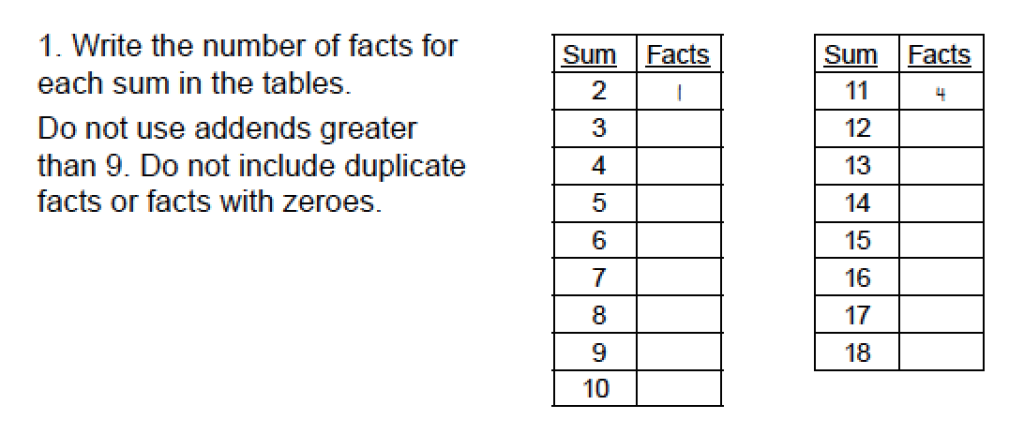
The lesson says: Name all the facts that have 11 as a sum. These facts cannot have any addends greater than 9, any duplicates, nor any facts with a zero.
Translation: What plus what equals 11? No numbers over 9, so 10 + 1 isn’t an option. No duplicates, so can’t have 8 + 3 and 3 + 8. Also no zeros.
That gives us the following facts:
11 = 9 + 2
11 = 8 + 3
11 = 7 + 4
11 = 6 + 5
What about:
11 = 5 + 6 – It’s a duplicate to 6 + 5, so no.
11 = 11 + 0 – This has a number over 9 and uses a zero, so double no.
The lesson then tells us to complete the tables on the worksheet.
Although I cannot speak for Karen, I know this is where the struggle began for me. Yes, I realize now these worksheet directions are basically copy and paste from the lesson (see above!), but at first glance, I was totally confused. <insert embarrassed grin here> Once I realized the lesson walked us through the first sum in the second table, 11, it was a breeze. Aaron thought so too….
So, let’s run through a few sums to make sure you’re all catching on here.
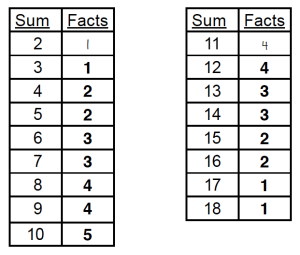
Sum of 2: We have 2 = 1 + 1. And that’s it. Other options are duplicates or use a zero. One fact. Write 1 in the table. Well, that’s actually done for us already. But we got the right answer!
Sum of 3: We can do 3 = 1 + 2 and no more. Write 1 in the table.
Sum of 4: Now we can have 4 = 1 + 3 and 4 = 2 + 2. Write 2 for the number of facts found.
Keep going until the table is completed. Did yours look like this?
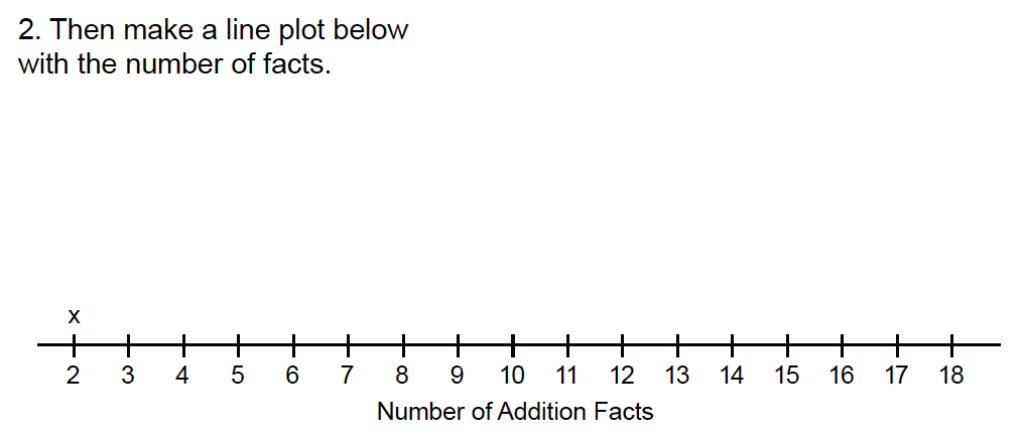
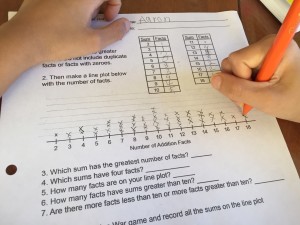
Next, the worksheet says to make a line plot using the number of facts.
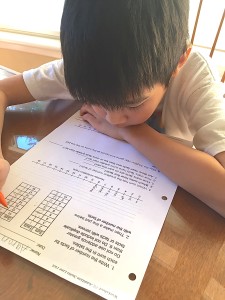
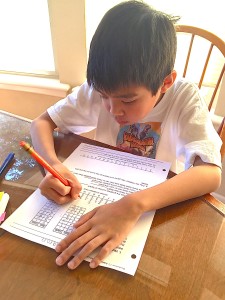
Look at Aaron’s work!
And his final results! Nice job, Aaron!
What patterns do you see? Here’s the completed graph from the lesson book:
The first question on the worksheet guides us to discovering which sum has the greatest number of facts. See the answer? It’s 10! That’s one of the reasons why it’s so important to practice the facts of ten by playing games. The Go to the Dump game comes to mind right away.
So, why in the world are we having our children do this process? There are a couple important reasons. First, plotting data helps us to analyze information. Without a graph, it’s harder to see a pattern. Graphs help us see patterns that might not be evident without the visual perspective.
Graphs are also more common than they used to be. Making graphs before reading them help children (and some adults) understand the structure and importance of graphs. Starting at this level while practicing addition facts is setting the children up for future success. And that’s what it’s all about!


Time for some more proofreading here 😉
Sum of 2: 1 + 2 ??
Sum of 4: 1 + 2 ??
Oh. My. Goodness!! I am so embarrassed. It’s corrected now, but I’m going to have to use my abacus next time……
Or at least, don’t use copy and paste!
Oh, wow. We haven’t reached that lesson yet. Please tell me that it isn’t as bad as it looks on here!
Actually, it’s quite fun! Enjoy!!